20-year Returns Outlook
Our T-GEM, or Temasek Geometric Expected Return Model, simulates the range of possible returns for our portfolio over the next 20 years. These simulations are not meant to predict actual outcomes.
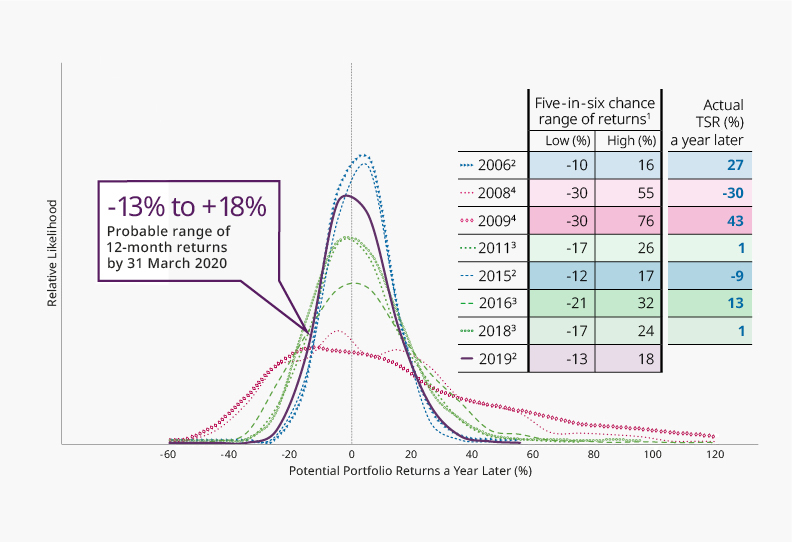
As the Temasek portfolio consists predominantly of equities, the T-GEM modelling approach seeks to reflect the volatile nature of equities. The chart below shows that historically, equity returns were volatile, even over long periods.
Economic Scenario-Based Approach
As equity returns are volatile over time, and influenced by macroeconomic or geopolitical events, T-GEM uses a scenario-based approach to simulate our 20-year long term expected returns. This approach takes into account our views of long term macroeconomic fundamentals over the next 20 years, adjusted for current market valuations.
Projection Based on Economic Fundamentals
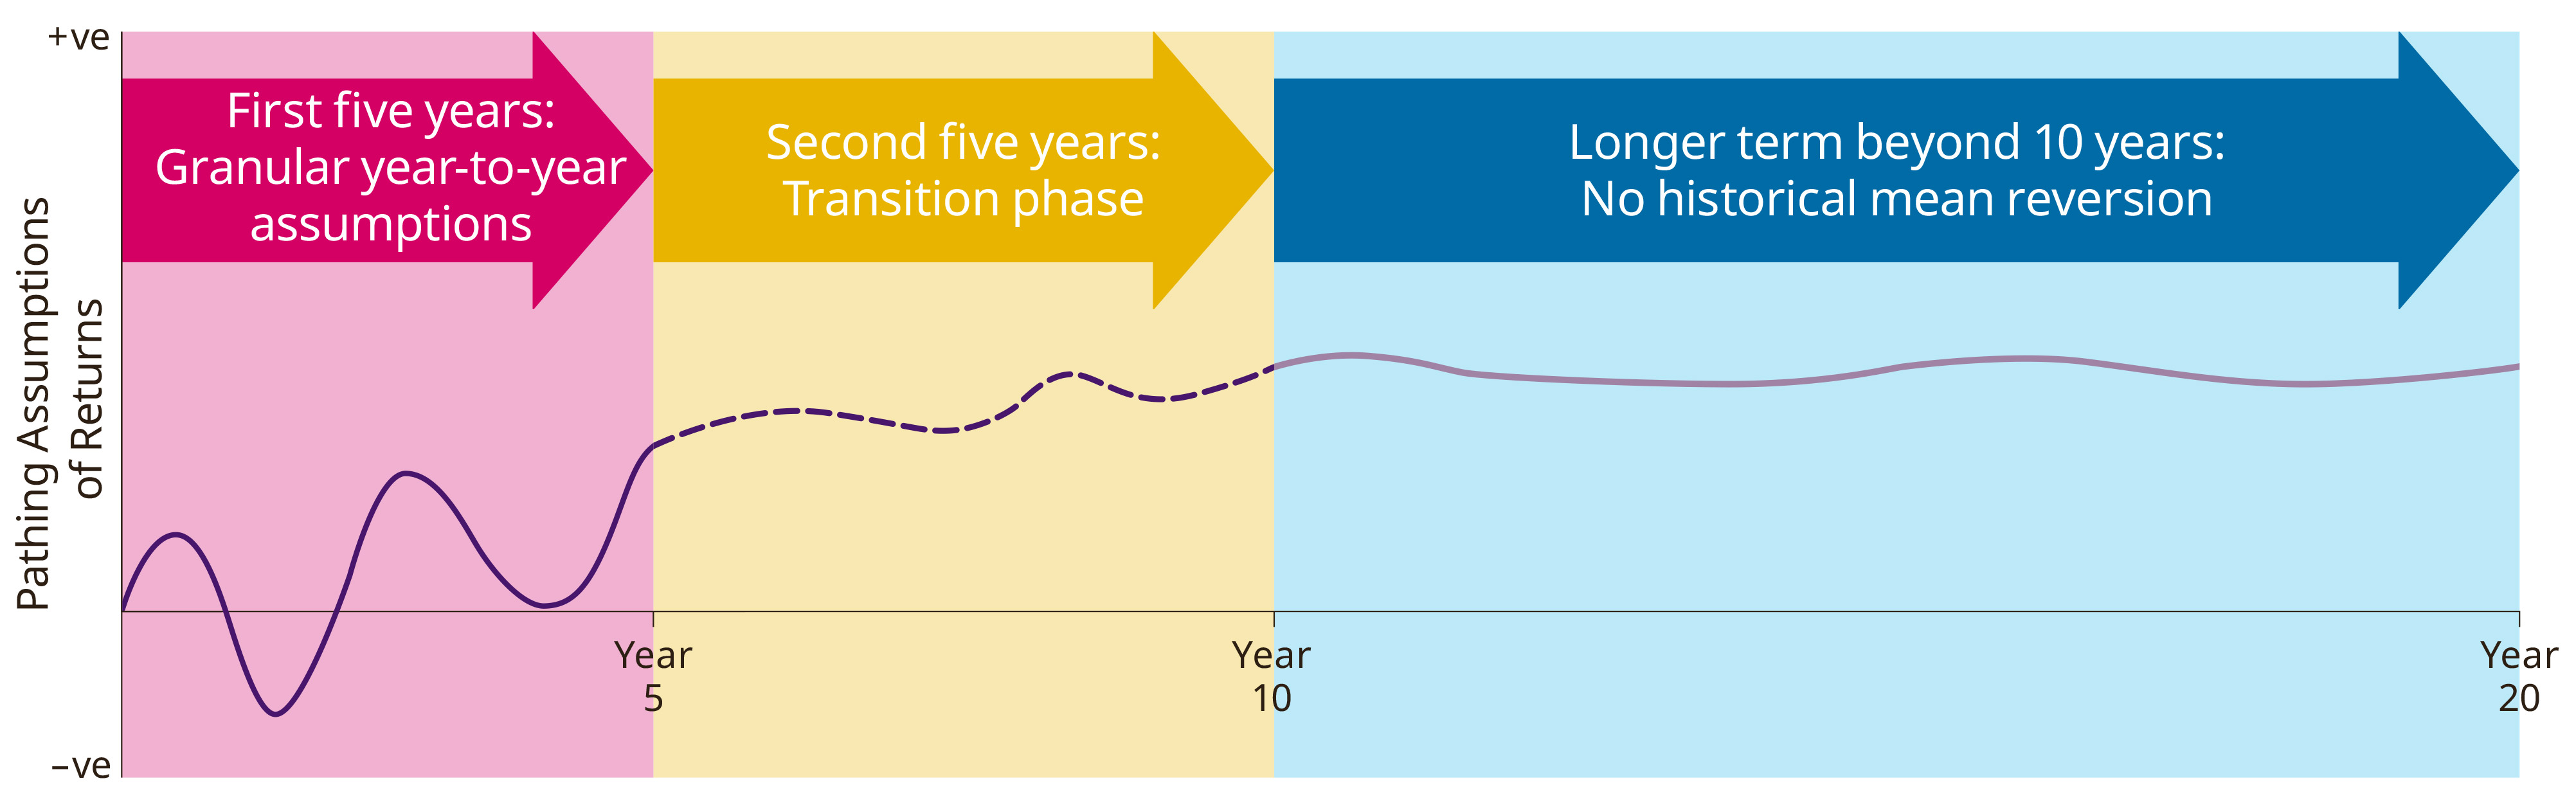
In projecting economic fundamentals, we make more granular year-to-year assumptions for the first five years, and transit to more general assumptions based on longer term fundamentals as we go beyond 10 years. This “pathing” approach incorporates assumptions about changes in economic conditions over time. We do not assume an equilibrium return that remains unchanged over the 20-year period, nor do we assume a reversion to the historical mean.
Economic Scenario Pathing (Illustrative)
20-year Expected Returns for Different Portfolio Mix
The charts below show the simulated returns for a Global Bond Portfolio, a Global Equity Portfolio and the Temasek Portfolio. The simulations are based on our Central Scenario.
The Global Bond Portfolio has the lowest upside potential, as compared to the Global Equity and Temasek Portfolios. It also has the least volatility, as shown by its narrower year-to-year annual returns distribution curve.
The Temasek Portfolio has the highest upside potential (see blue shaded) at the end of the 20-year period, but also the highest volatility.
(as at 31 March 2019)
Likelihood of Geometric Returns (Compounded Annualised) at the End of 20-year Period, by Portfolio Mix
(as at 31 March 2019)
Likelihood of Year-to-year Annual Returns during 20-year Period, by Portfolio Mix
20-year Expected Returns for Various Temasek Scenarios
We simulate our 20-year expected returns under different scenarios.
Potential Scenarios for 2019 and Beyond
| Potential Scenarios | Description |
|---|---|
| Central | Our baseline expectations of growth, reflecting our views of the most likely economic pathway. |
| China Hard Landing | A sharper than anticipated slowdown in growth, as reforms prove too slow to rebalance the economy and address corporate debt-related vulnerabilities. This is a less likely alternate scenario. |
| Severe Escalation in Trade and Tech Tensions | Significant increase in trade and investment conflicts amongst major economies, with substantial escalation in barriers to global trade, access to key inputs and technology. This is a less likely alternate scenario. |
| Secular Stagnation | An alternate scenario where underlying potential growth is much weaker than expected. Together with a lack of policy space, this makes the global economy more susceptible to prolonged downturns. This is a less likely alternate scenario. |
The T-GEM 20-year returns curves for the Temasek Portfolio are shown below for the Central, China Hard Landing, Severe Escalation in Trade and Tech Tensions, and Secular Stagnation Scenarios.
The Central Scenario offers the highest expected 20-year returns for the Temasek Portfolio, compared to those under the three alternate scenarios.
(as at 31 March 2019)
Likelihood of Geometric Returns (Compounded Annualised) at the End of 20-year Period, by Potential Scenario
(as at 31 March 2019)
Likelihood of Year-to-year Annual Returns during 20-year Period, by Potential Scenario
Discover More