Overview
Performance Overview
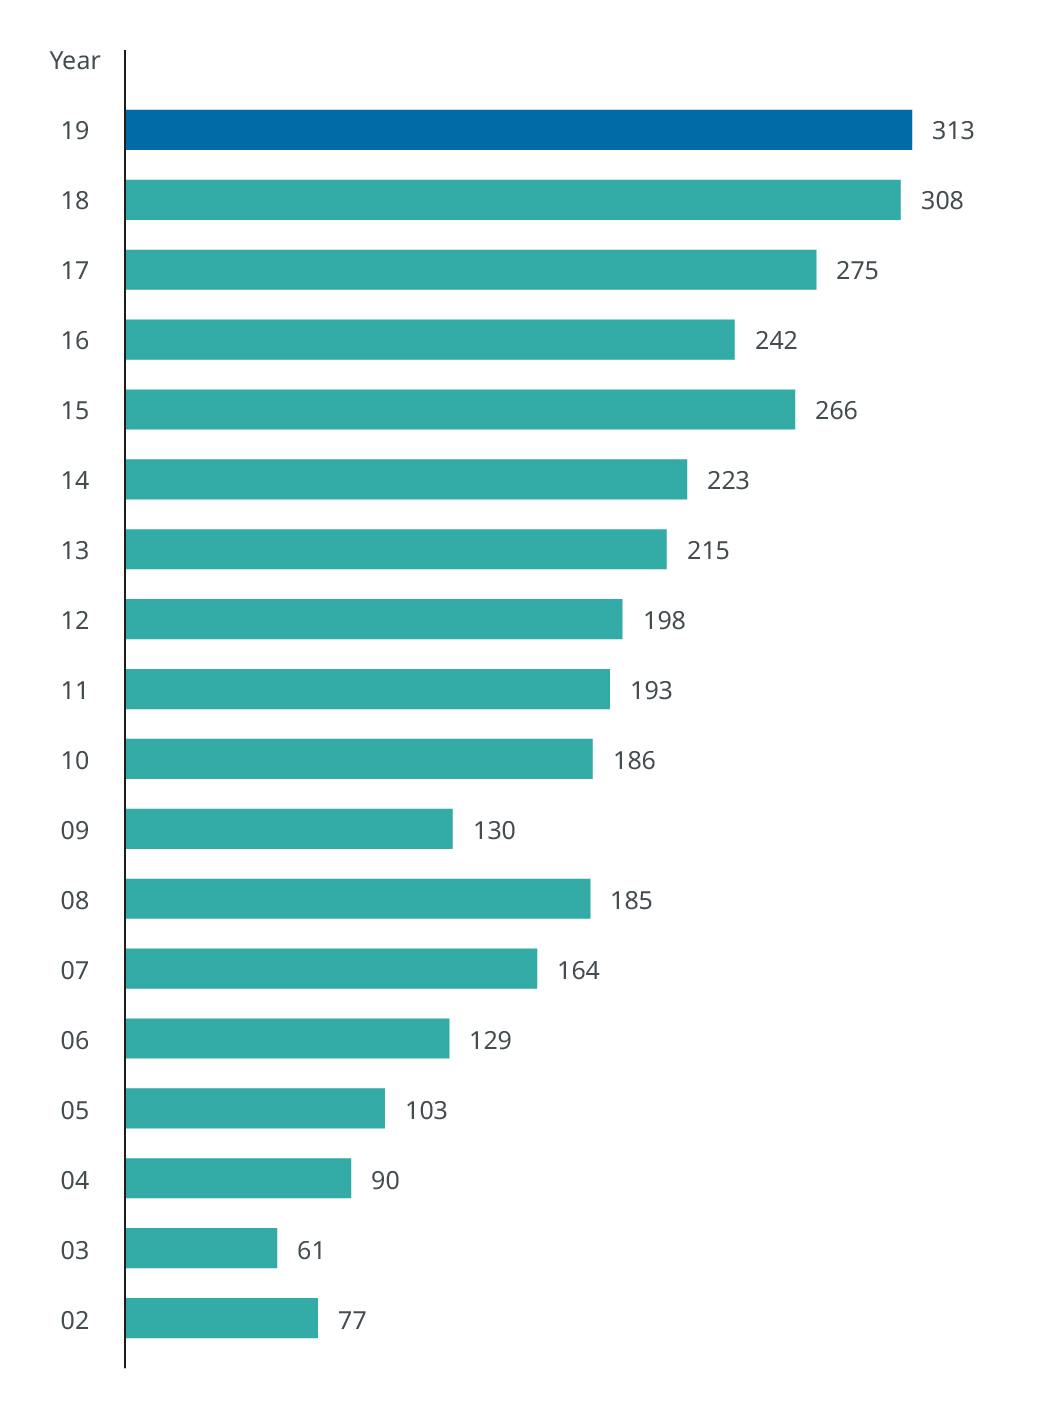
We ended the year with a net portfolio value of S$313 billion.
(as at 31 March)
S$313b
Net portfolio value
Up S$183 billion over the last decade
Net Portfolio Value (S$b)
S$24b
Invested during the year
Invested S$218 billion over the last decade
Investments & Divestments (S$b)
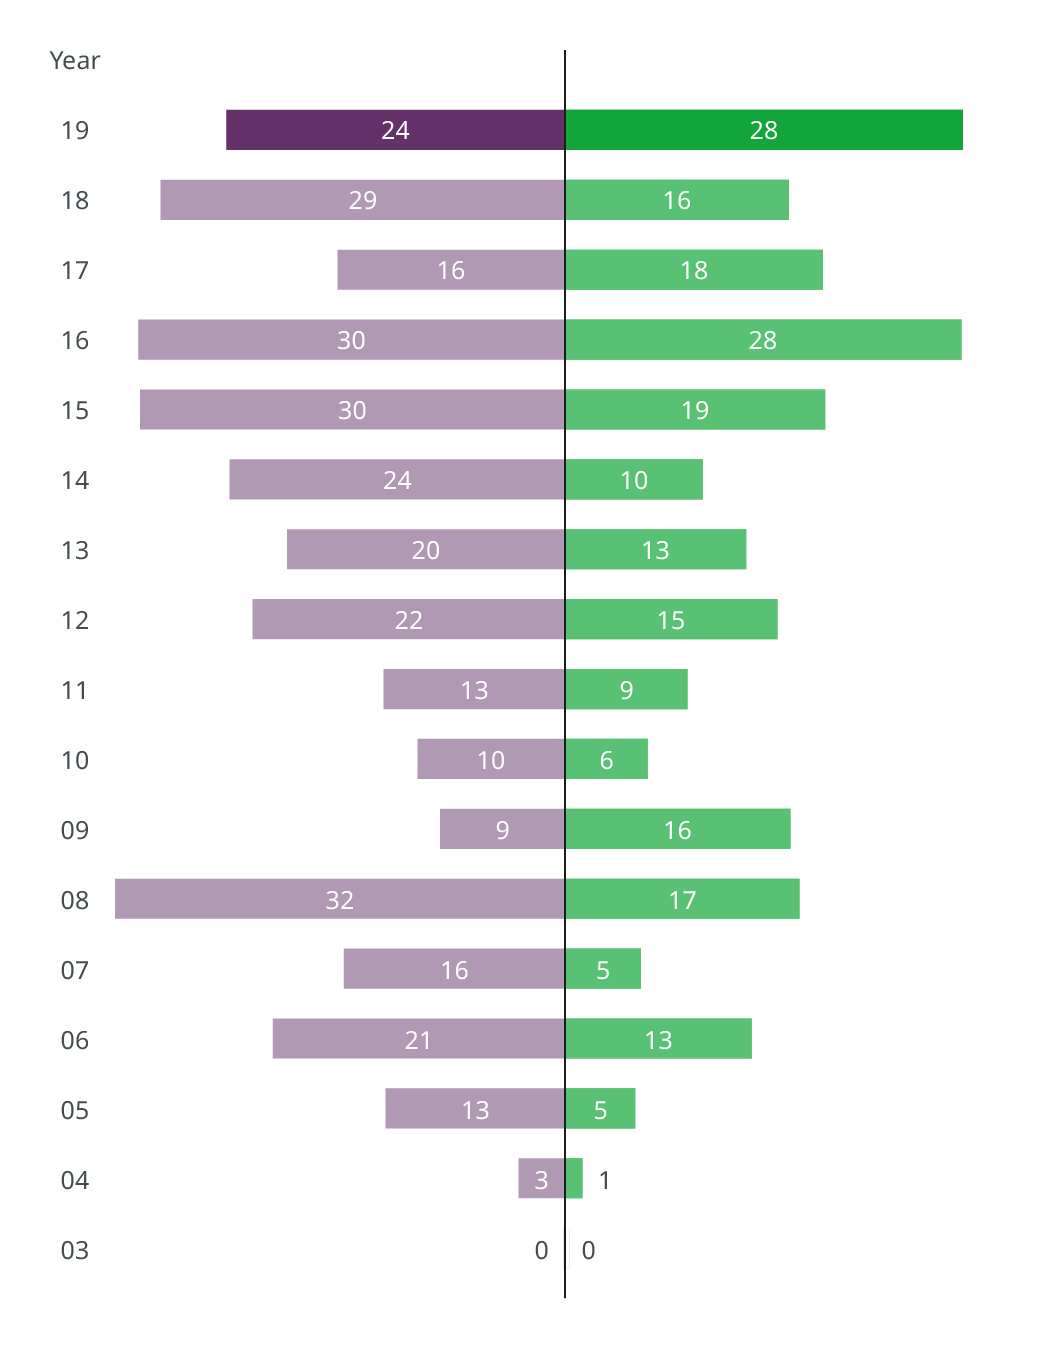
- Investments
- Divestments
66%
Exposure to Asia
Singapore exposure up S$41 billion over the last 10 years
Portfolio by Geography (%)
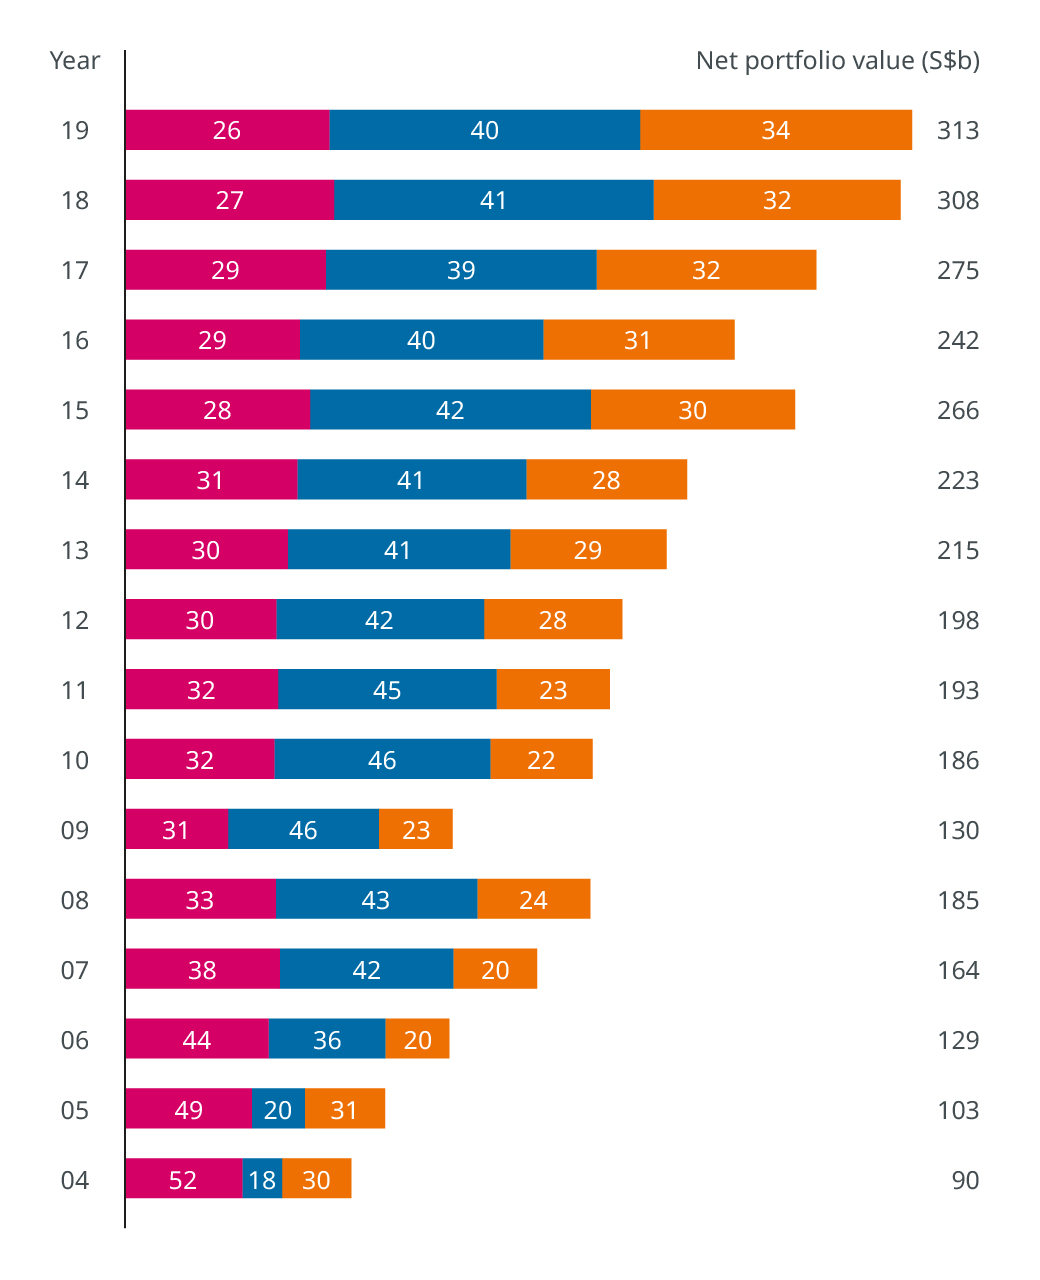
Chart Notes
- Singapore
- Asia ex-Singapore
- Rest of world
1.49%
One-year return to shareholder
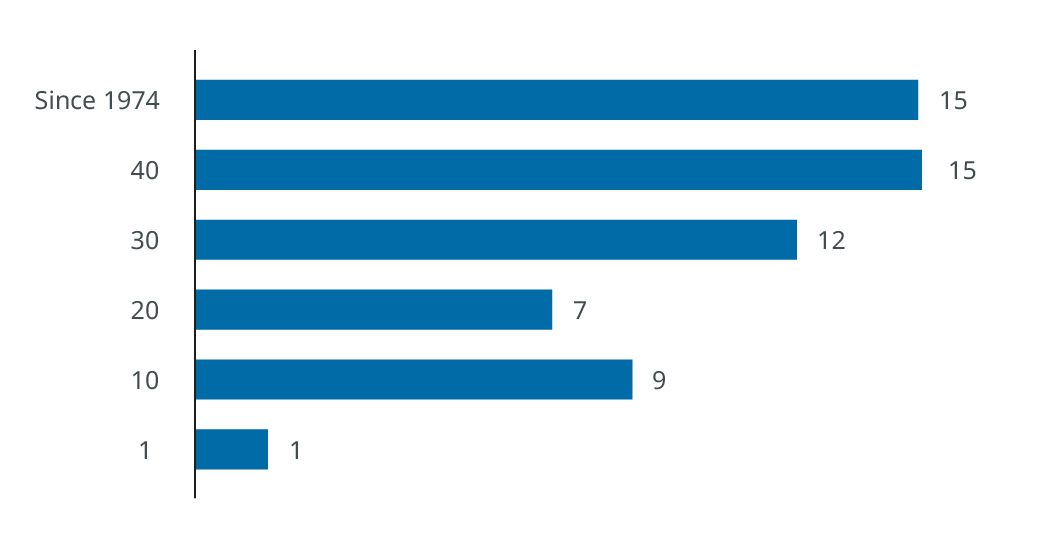
Total shareholder return of 15% since inception
S$ Total Shareholder Return (%)
9%
Ten-year return to shareholder
One-year returns of -9% to 43% during the last decade
Rolling S$ Total Shareholder Return (%)
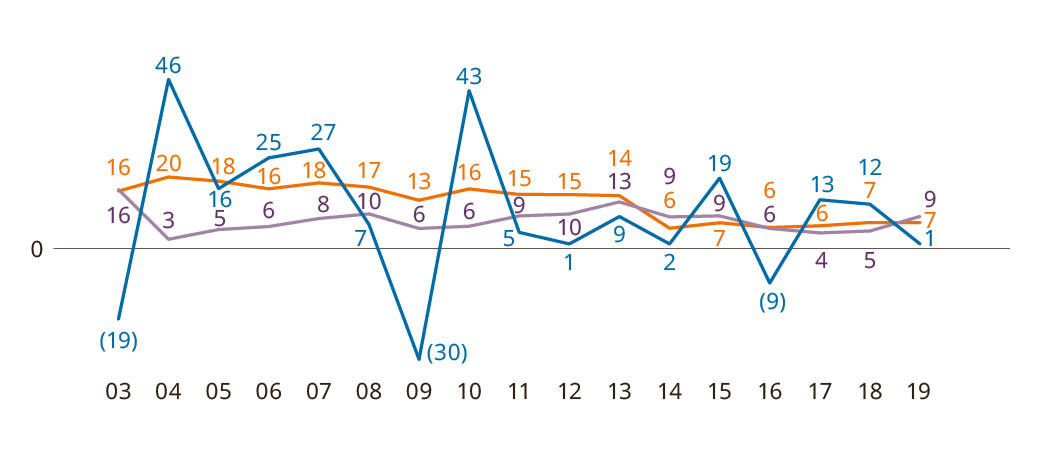
- One-year
- 10-year
- 20-year
S$9b
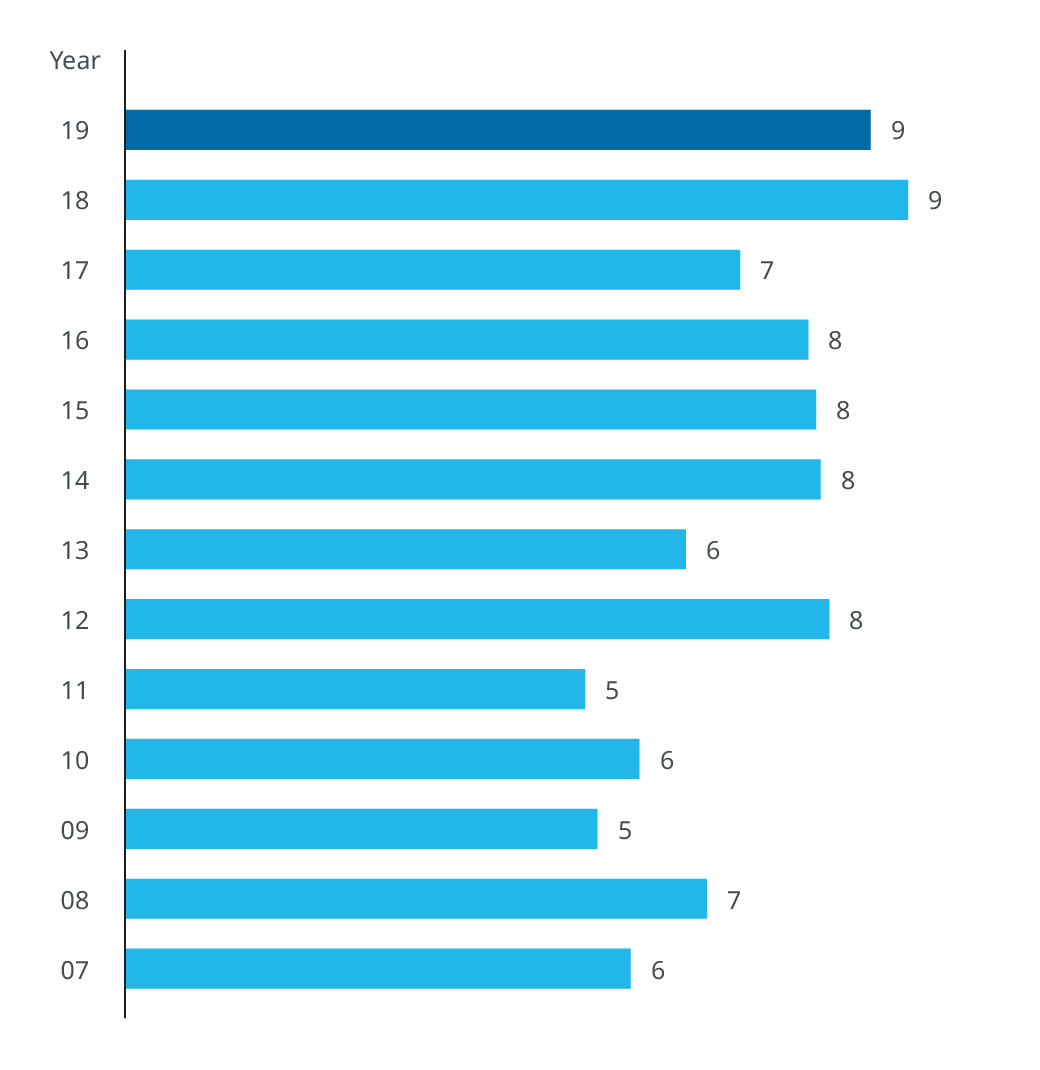
Dividend income
Average annual dividend income of S$7 billion over the last decade
Dividend Income (S$b)
Discover More